Site-calibrated CPT interpretation for engineers: QA and audit-ready reports

Cone penetration testing delivers a continuous soil profile built from tip resistance, sleeve friction and pore pressure, from which engineers derive soil behavior type, corrected cone resistance (qt), and estimates of undrained strength, relative density, friction angle, overconsolidation ratio and permeability. Stratigraphy and relative stiffness carry high to moderate confidence, particularly when paired with shear-wave velocity. Undrained strength and permeability estimates, by contrast, hinge on cone factors and drainage assumptions that demand site-specific calibration against triaxial, vane or dissipation data before they belong in a design report.

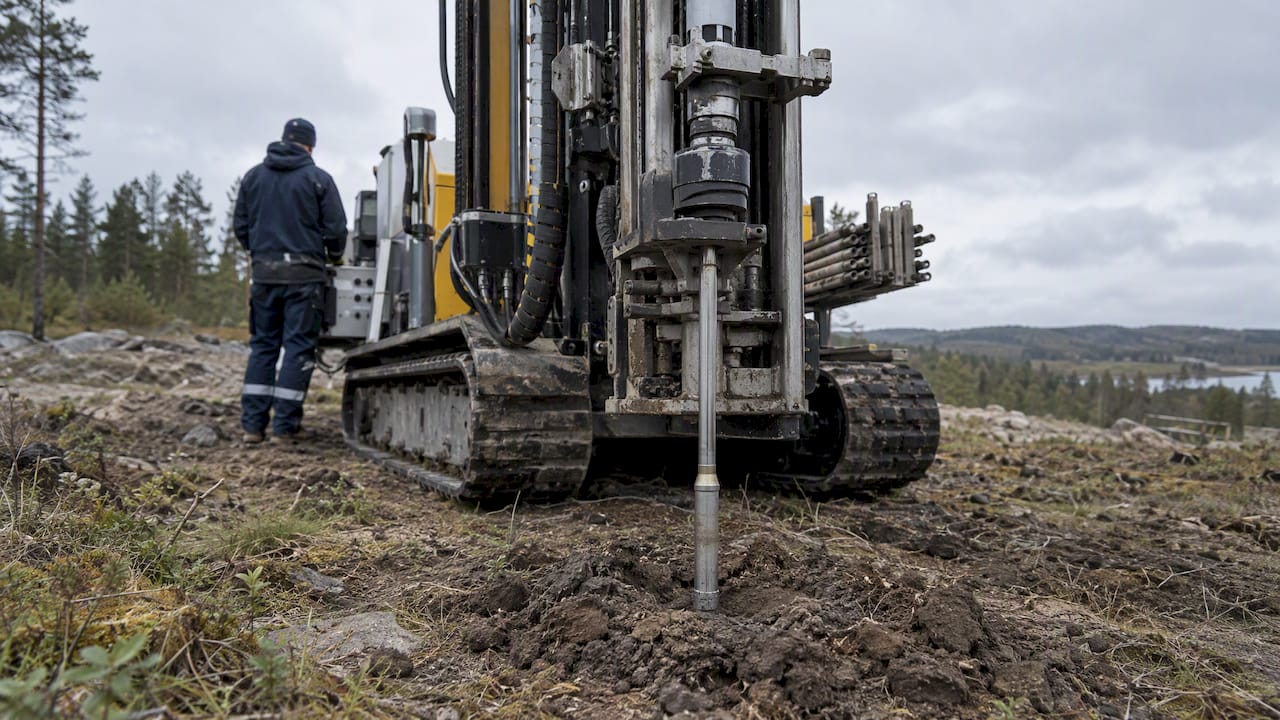
CPTu rig advancing a sounding rod into soil
  • Treat CPT strength, density, friction angle, and overconsolidation estimates as provisional until local triaxial or vane tests calibrate their correlations.
  • Normalized Ic values below about 2.60 indicate sand behavior, while values above 2.95 indicate clay behavior; treat intermediate soils and layers under 15 centimeters cautiously.
  • Use continuous pore pressure estimates to screen mixed or silty ground, but run dissipation tests in low permeability clay when design depends on accurate permeability.
  • Before applying correlations, check calibration, penetration rate, verticality, pore pressure filter saturation, and raw channel plots; lower ISO application classes may suit screening, not final foundation design.

CPT measurements and corrected parameters: Qc, fs, u2 and vs

A standard CPTu push records three continuous signals as the cone advances at a fixed rate, typically 20 millimeters per second. Cone tip resistance (qc) measures the force needed to push the conical tip through soil and reflects strength and density. Sleeve friction (fs) measures resistance along a friction sleeve behind the tip and responds to soil plasticity and remolded strength. Pore pressure (u2), recorded at the shoulder behind the cone, captures how the soil responds to loading and whether drainage occurs fast enough to dissipate excess pressure as the cone passes. Seismic CPT (SCPT) adds a geophone to record shear-wave velocity (Vs), which feeds directly into small-strain stiffness calculations without relying on empirical correlations at all.

Raw tip resistance needs correction before it means anything in design. The Settle3 CPT theory manual sets out how qc is corrected to total cone resistance (qt) by accounting for unequal end-area effects at the cone shoulder, a correction that matters most in soft, fine-grained soils where pore pressure is high. Equilibrium pore pressure (uo), established from a dissipation phase or hydrostatic assumptions, anchors the normalization calculations that follow. Recording frequency matters too: most modern systems log at every 1 to 2 centimeters of penetration, dense enough to catch thin lenses but also dense enough to record noise that needs filtering before interpretation.

Several artifacts show up in nearly every raw dataset and need attention before any correlation is applied:

  • Rod-joint noise: small resistance spikes at standard rod-length intervals, typically every meter, that reflect equipment geometry rather than soil.
  • Unloading spikes: brief drops in qc caused by gravel particles or debris temporarily jamming against the cone face.
  • Sensor drift: a slow baseline shift in fs or u2 readings over a long push, usually traceable to temperature effects on the load cells.
  • Saturation loss: a piezocone that loses full saturation produces lagged, damped pore-pressure response, visible as a sluggish u2 trace that fails to track qc transitions.

A quick QC pass, plotting all three channels against depth and flagging discontinuities before running any correlation, catches most of these before they propagate into a stratigraphic misread.

How do you assign soil behavior type from CPT data?

Soil behavior type assignment starts with normalizing cone resistance and friction ratio for overburden stress, since raw qc values from shallow and deep soils are not directly comparable. The normalized cone resistance (Qt) and normalized friction ratio (Fr) form the basis of the widely used SBTn chart described in Robertson’s unified approach to CPT interpretation. A third parameter, the pore pressure ratio (Bq), compares excess pore pressure to effective overburden stress and helps separate drained sands from undrained clays that might otherwise produce similar Qt values.

From these three normalized parameters, Robertson’s framework computes a soil behavior type index (Ic), a single number that locates a data point within the SBTn chart’s nine zones, ranging from sensitive fine-grained soils at low Ic to gravelly sands at the other extreme. Practitioners generally treat Ic values below about 2.60 as sand-like and above about 2.95 as clay-like, with the intervening band representing silt mixtures where behavior is genuinely transitional rather than ambiguous due to measurement error.

Working through an SBTn classification in practice involves a few consistent steps:

  • Compute effective and total overburden stress at each depth increment from unit weight estimates or known stratigraphy.
  • Normalize qt and fs to get Qt and Fr, then calculate Bq from measured and equilibrium pore pressures.
  • Plot Ic against depth alongside the raw qc and fs traces to confirm that index shifts correspond to genuine resistance and friction changes rather than noise.
  • Cross-check classification zones against any available borehole log at the same location before finalizing a stratigraphic column.

Transition zones deserve particular caution. A single narrow spike in qc surrounded by consistent clay-like readings more often reflects a thin sand lens, a shell fragment or sensor noise than a meaningful stratigraphic unit, and assigning it a full soil layer in a design cross-section overstates what one data point can support.

Pro Tip: Treat any soil behavior type that persists for less than about 15 centimeters as a candidate for exclusion or merging with the adjacent layer unless independent evidence confirms it.

Estimating su, dr, φ’, OCR and stiffness from CPT

Turning normalized CPT parameters into design values is where semi-empirical correlations, and their inherent scatter, enter the picture directly. The CPT-Based Geotechnical Design Manual from Purdue’s Joint Transportation Research Program lays out spreadsheet-based procedures for exactly this step, and the Settle3 CPT theory manual notes that CPT and CPTu data can feed over 30 distinct geotechnical parameters once qc, fs and u2 are processed through the right equations.

A short set of correlations covers most routine interpretation work:

  1. Undrained shear strength (su): derived from the cone factor relationship su = (qt minus total overburden stress) divided by Nkt, with Nkt commonly ranging from 10 to 18 depending on soil plasticity and sensitivity, and a conservative default typically recommended in the mid-teens absent site-specific calibration, according to a geotechnical engineering reference on CPT parameter derivation.
  2. Relative density (Dr) in sands: estimated from normalized cone resistance using chamber-calibrated correlations that account for grain compressibility and stress level, generally more reliable in clean quartz sands than in carbonate or highly compressible sands.
  3. Friction angle (φ’): back-calculated from Qt through empirical relationships that assume drained behavior, applicable mainly to granular soils where dilation and particle crushing effects are reasonably well bounded.
  4. Overconsolidation ratio (OCR): estimated from normalized cone resistance (Qt) using a simple power-law relationship, though the coefficient varies with plasticity index and sensitivity, making OCR one of the less precise outputs without local calibration.
  5. Unit weight (γ): approximated from a combination of friction ratio and cone resistance, useful mainly for computing overburden stress rather than as a final design value.
  6. Stiffness moduli (E and G): estimated from Qt-based correlations when shear-wave velocity is unavailable, but far more reliable when measured directly via SCPT, since small-strain shear modulus (G0) computed from Vs avoids empirical scatter entirely.

Stress level and stress history distort several of these correlations in predictable ways. Normalized parameters already account for overburden stress, but OCR and su correlations derived in one geologic setting, say glacial tills, do not transfer cleanly to young deltaic or residual soils without adjustment, because the underlying cone factor reflects soil fabric as much as strength. The 2024 CPT Guide from Robertson and Cabal is blunt on this point: CPT is an excellent screening tool, but empirical correlations applied without site-specific calibration can produce errors large enough to matter in foundation design.

Processing the raw profile before applying correlations improves reliability. Depth-wise smoothing over a short moving window, typically 20 to 30 centimeters, removes single-point noise without masking genuine layer boundaries. Where lab or field calibration data exist, even from a handful of co-located triaxial or vane tests, fitting a local Nkt or Dr coefficient and reporting the resulting uncertainty band gives a design team a far more honest picture than a single point estimate from a generic textbook coefficient.

Pore pressure, dissipation testing and permeability from CPTu

The pore pressure channel (u2) does more than support soil classification: its behavior during a controlled pause in penetration, a dissipation test, is the primary route to estimating in-situ permeability. Bq, the normalized excess pore pressure ratio, compares measured u2 against equilibrium pore pressure (uo) and effective overburden stress, and a Bq near zero in a soil that classifies as clay-like on the SBTn chart often signals partial drainage rather than a misclassification.

A dissipation test holds the cone stationary and records pore pressure decay over time, with t50, the time for 50% of excess pressure to dissipate, serving as the standard input to permeability correlations. Low-permeability clays can require dissipation holds lasting a substantial period to reach t50, a real cost in field time that project schedules often underestimate.

Research on permeability estimation methods shows that on-the-fly approaches, which estimate hydraulic conductivity from the continuous CPTu record without stopping the cone, perform reasonably well in partly drained silts but are not reliable substitutes for dissipation testing in highly undrained clays, according to a numerical evaluation of on-the-fly CPTu methods. The practical implication is straightforward:

  • Use on-the-fly estimation to screen permeability trends quickly across a long sounding in mixed or silty ground.
  • Reserve full dissipation tests for critical low-permeability layers where consolidation time or seepage design depends on an accurate k value.
  • Treat a single t50 reading as a point estimate, not a layer average, since vertical pore-pressure migration and layering can bias the result, a caution raised directly in research on dissipation test interpretation and drainage effects.

QA, calibration and the standards that govern CPT testing

Interpretation quality is bounded by test quality, which is why ISO 22476-1 specifies equipment tolerances, penetration rate, verticality limits and reporting requirements for CPT and CPTu work, along with defined application classes that set expected measurement accuracy for different project tiers. A sounding performed under a lower application class may be adequate for preliminary screening but insufficient for final foundation design, a distinction worth confirming before data collection begins rather than after.

A short QA checklist catches most field and processing errors before they reach a design report:

  • Confirm cone and transducer calibration certificates meet project requirements.
  • Check verticality and penetration rate logs for deviations exceeding standard tolerances.
  • Verify recording frequency and pore pressure filter saturation before accepting data.
  • Plan dissipation test depths ahead based on preliminary results.
  • Cross-check selected soundings against other site data to validate cone factors.

Pro Tip: Flag any sounding where Bq assumptions about drainage conditions are not supported by an actual dissipation test, since assuming fully undrained or fully drained behavior without evidence is one of the most common sources of misinterpreted CPT results.

Beyond drainage assumptions, two other mistakes recur across project reviews: applying a generic cone factor from a textbook table without checking it against local soil mineralogy or sensitivity, and ignoring anisotropy or thin-layering effects when a thick, apparently uniform zone actually contains interbedded sand and silt that behaves differently under load than either material alone.

Building a site-calibration workflow engineers can defend

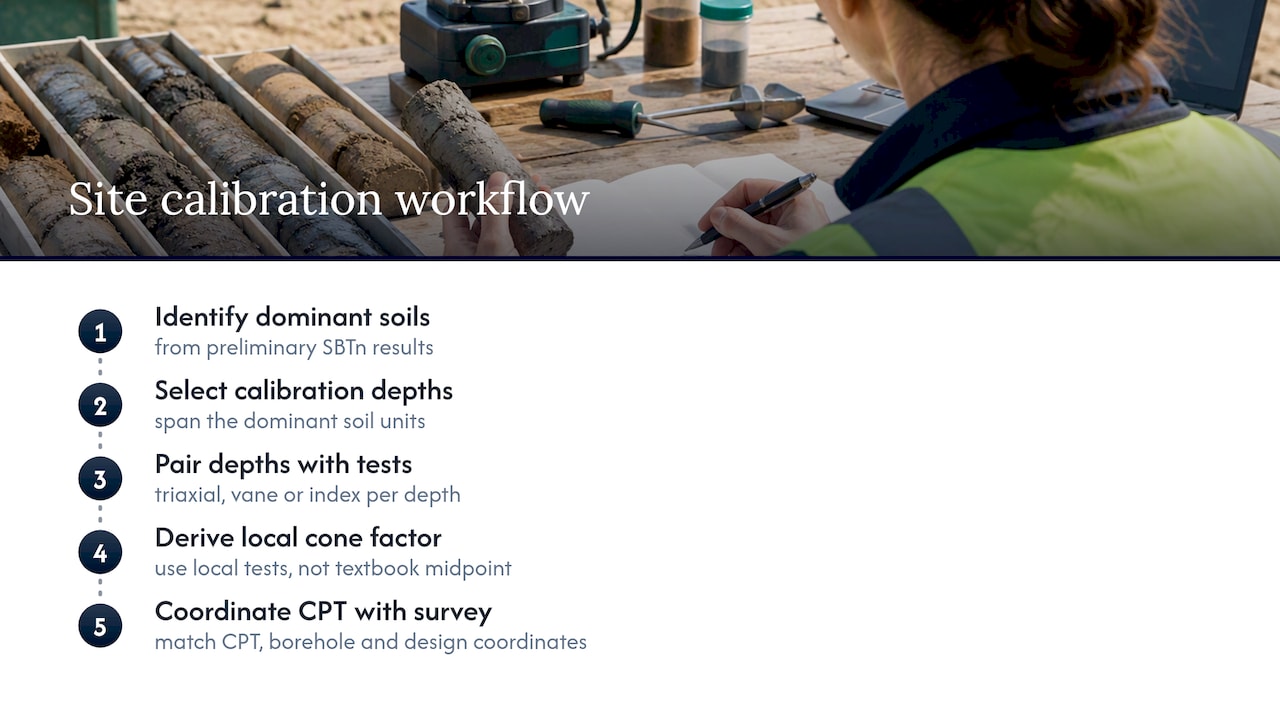
A defensible interpretation starts with a calibration plan, not a correlation table. Select calibration depths that span the dominant soil units identified from preliminary SBTn results, pair each with a targeted triaxial, vane or index test, and derive a local cone factor rather than defaulting to a textbook midpoint. Where survey or geospatial integration is part of the deliverable, coordinating CPT locations with a precise topographic or boundary survey, the kind of work firms like SGS Surveys provide, keeps borehole, CPT and design coordinates consistent across the project record.

Steps for a defensible site calibration workflow

Engineering-assist platforms have a role here, mainly in the volume and consistency work that surrounds interpretation: extracting raw protocols into structured datasets, flagging soundings that deviate from expected trends, and drafting report sections with assumptions stated explicitly for engineer review. We built Yesper around that kind of document-heavy, end-to-end deliverable work, and customers using the platform across their project workflows report time savings of 50% to 95%, alongside catching errors that human reviewers missed. None of that replaces field validation or local calibration. It shortens the distance between raw field data and an audit-ready draft.

Where machine learning fits in CPT interpretation today

Random forest and neural network models have shown strong results classifying soil behavior type from large CPT datasets, with one study reporting accuracy at very high levels, typically exceeding 95% against Robertson SBT targets. That performance is real, but it is also dataset-specific: a model trained on one geologic setting carries no guarantee of transferring to another, and the same research stresses validation against local borehole data before any design use. The sound path is phased: pilot a classifier on a known dataset, validate predictions against boreholes from the current site, then fold it into an existing QA workflow rather than letting it substitute for one.

Turning CPT soundings into audit-ready reports faster

Processing dozens of CPT soundings by hand, checking each against ISO application classes, and writing up assumptions for every correlation used is the kind of document-heavy task that eats a disproportionate share of a project schedule. We have built a tool to help construction and infrastructure teams move through exactly that kind of work, converting raw CPT protocols into structured, auditable deliverables with assumptions written down for review, the way you would review a colleague’s work.

  • It helps extract and structure data from CPT protocols and prior site investigations.
  • It flags inconsistencies across soundings, such as unexplained Ic shifts or missing dissipation data, for engineer review.
  • It drafts report sections with correlations and coefficients stated explicitly rather than buried in a spreadsheet.

None of this replaces a field program or a calibrated cone factor. It gets you to a reviewable draft faster. Learn more about how Yesper works for infrastructure teams.

What is the difference between SPT and CPT?

The Standard Penetration Test (SPT) drives a split-spoon sampler in stages inside a borehole and yields blow counts (N-values) plus physical soil samples, while the Cone Penetration Test pushes an instrumented cone continuously and records tip resistance, friction and pore pressure without recovering a sample. CPT produces a far more continuous profile and is generally faster, but SPT remains valuable because it delivers a physical sample for laboratory testing that CPT cannot provide.

What does a CPT test tell you?

A CPT sounding delivers a continuous profile of soil behavior type, strength indicators and stiffness trends derived from tip resistance, sleeve friction and pore pressure, as detailed in the Settle3 CPT theory manual. From that profile, engineers estimate undrained strength, relative density, friction angle, overconsolidation ratio and, through dissipation testing, permeability.

What is a good SPT value?

There is no universal “good” SPT value since the appropriate blow count depends entirely on soil type, depth and the specific foundation or design question being asked. An SPT N-value is interpreted relative to established correlations for density or consistency at a given depth and stress level, not against a fixed benchmark.

What is CPT measurement?

CPT measurement refers to the continuous recording of cone tip resistance (qc), sleeve friction (fs) and, in a piezocone, pore pressure (u2) as an instrumented probe is pushed into the ground at a constant rate. These raw signals are corrected and normalized to classify soil behavior type and estimate geotechnical design parameters, following procedures set out in standards like ISO 22476-1.

This post was written with AI assistance and published by Yesper. General information, not professional advice: requirements vary by project and jurisdiction, and the professional responsible for the project decides what applies. Spotted an error? Write to benjamin@yesper.ai.

Benjamin Glaser Co-founder at Yesper. Writes about AI and the industry that builds the world. benjamin@yesper.ai

Yesper is the AI civil engineer for construction and infrastructure. AFRY, COWI, NRC Group and other Nordic firms use it to halve the time on a study, rerun calculations in minutes, and catch errors that would otherwise slip through. Get in touch if you'd like to see what it can do for you.

Book demo