Sweden's national audit office has answered the question of where infrastructure costs grow. Twice, in writing: the increases happen during planning, not construction. Here is how to read the two audits, and how to cite them without getting the numbers wrong.
Benjamin Glaser
28 March 2026 · 6 min read
The 2021 audit
Projects grow by more than a third before construction
By more than a third in four years. In June 2021 Riksrevisionen published Kostnadskontroll i infrastrukturinvesteringar (RiR 2021:22), an audit of 285 investment projects in the national transport plans of 2004, 2010, 2014 and 2018. For the 142 projects that appeared in both the 2014 and 2018 plans, estimated costs grew by 58 billion kronor in total: an average increase of 39 percent per project, in four years. This post is a reading guide to that audit and its 2023 follow-up, for anyone who wants to argue from the primary sources rather than from second-hand summaries.
Time in the system compounds the growth. Projects carried in the plans since 2010 had grown 68 percent by 2018, with a median of 23 percent. The cohort that entered in 2004 had grown 165 percent on average, with a median of 60 percent: a project that sits in planning for fourteen years ends up, on average, at more than two and a half times its first estimate. The auditors compressed the finding into one sentence:
De systematiska kostnadsökningarna förefaller främst inträffa under planeringsfasen; i byggfasen hittar Riksrevisionen inga systematiska kostnadsavvikelser.
Riksrevisionen, RiR 2021:22 (2021). "The systematic cost increases appear to occur mainly during the planning phase; in the construction phase, the National Audit Office finds no systematic cost deviations."
The build phase
The overrun does not happen on site
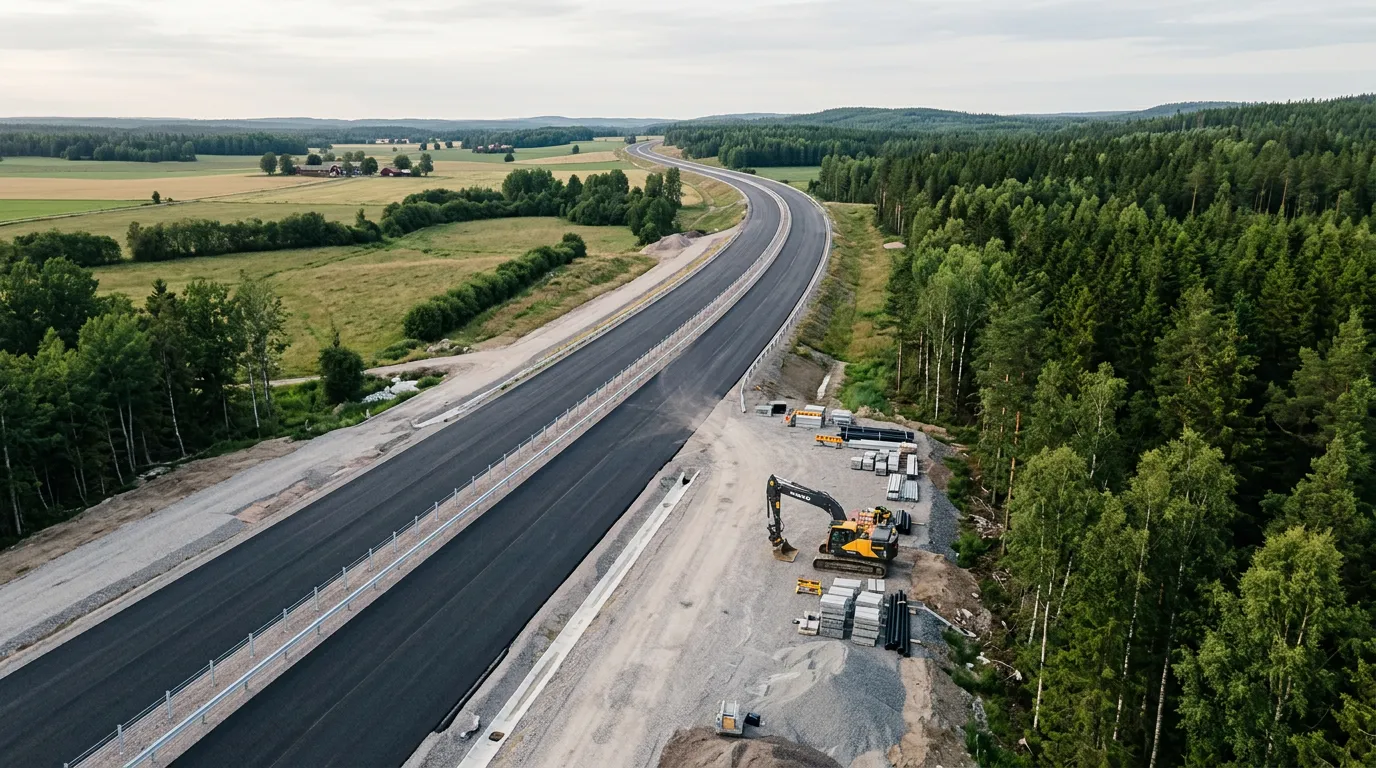
No, and that is the quiet part. For the 86 completed projects where the auditors could compare the final cost against the estimate at construction start, the mean deviation was plus 2 percent and the median minus 3 percent. The median finished project came in below its build-start estimate. At the contract level, Trafikverket delivers roughly what it promises when construction begins. By then, the growth has already happened. Whoever blames the excavators is arguing against the audit record.
The audit also records why the early increases carry through to the final bill: once a project has entered the national plan, it stays there. "Regeringen håller ofta fast vid sitt första investeringsbeslut", the auditors write: the government often holds on to its first investment decision, and it is very rare for a project to be stopped, however far the estimate has drifted. Förbifart Stockholm shows the scale this can reach: approved at 27.6 billion kronor in 2009, it stood at a likely 51.5 billion in Trafikverket's January 2024 prognosis.
The follow-up
The 2023 follow-up split planning from construction
A cleaner split. In December 2023 Riksrevisionen published Nationell plan för transportinfrastrukturen – lovar mer än den kan hålla (RiR 2023:25). Between the 2018 and 2022 national plans, estimated costs for projects still in planning, "unbound measures" in the report's terminology, rose 51 percent. Projects already under construction rose 16 percent. Same four years, same agency, same inflation: the only difference between the two groups is whether building had begun.
The sums are not rounding errors. The total increase came to 112 billion kronor, almost exactly the 111 billion in new funding the 2022 plan received. Four years of cost growth on projects already in the plan swallowed the equivalent of the entire new appropriation.
How to cite it
The 51 percent is the figure people cite wrong
The 51 percent figure is the one people get wrong. It comes from RiR 2023:25, not from the better-known RiR 2021:22, and it means that planning-phase projects grew 51 percent between two plan cycles. It does not mean that 51 percent of all cost growth happens in planning. Secondary sources conflate the two reports and the two readings routinely, and an opponent who spots the slip gets to dismiss everything else you said. The precision is the point. A cheat sheet:
What was measured
Figure
Report
Projects in both the 2014 and 2018 plans, average increase
+39% (SEK 58 bn)
RiR 2021:22
Cohort in the plans since 2004, growth by 2018
+165% (median +60%)
RiR 2021:22
Completed projects vs build-start estimate (n = 86)
mean +2%, median −3%
RiR 2021:22
Projects still in planning, 2018 plan to 2022 plan
+51%
RiR 2023:25
Projects under construction, same period
+16%
RiR 2023:25
Total increase, vs SEK 111 bn in new funding
SEK 112 bn
RiR 2023:25
Read together, the two audits say something stronger than either says alone. Two audit teams, two plan cycles, one consistent location for the increases: the planning years, before the first excavator arrives. What fills those years is engineering work: investigation, design, review and revision, not a cubic metre of concrete. Anyone who wants to bend the curve has to start where the growth starts.
Benjamin GlaserCo-founder at Yesper. Writes about AI and the industry that builds the world.benjamin@yesper.ai
Get news and articles in your inbox.
Unsubscribe anytime.
The phase before groundbreaking is engineering work: studies, design, review, not cubic metres of concrete. Yesper does it at machine pace and recomputes when the material changes. Book a demo and we'll show you how.